Journal: bioRxiv
Article Title: Elevated glucose in kidney organoids induces tissue-intrinsic inflammation driving epithelial detachment
doi: 10.1101/2025.09.05.669416
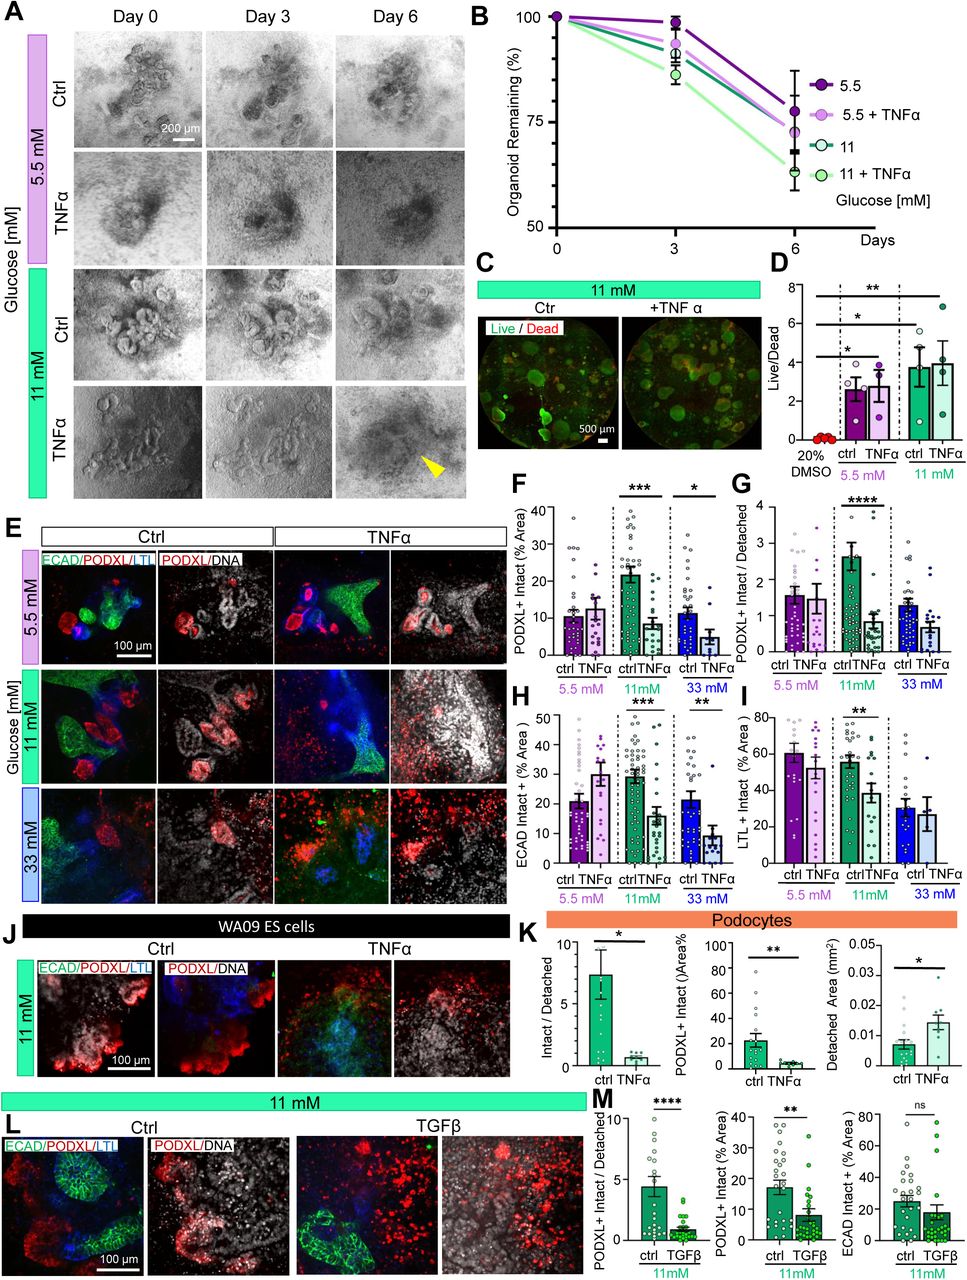
Figure Lengend Snippet: A) Time-lapse phase contrast images showing the progression of human kidney organoid morphology over six days of culture. B) Quantification of the percentage of organoids remaining on days 3 and 6 of glucose treatment ± TNF-alpha, relative to day 0 (mean ± stderr from n ≥ 4 independent experiments). C) Wide-field images and D) quantification of live-dead staining in organoids (mean ± stderr from n = 4 wells pooled from 3 independent experiments). E) Representative confocal immunofluorescence images showing a single optical section (20x magnification) for each condition. F) Quantification of PODXL intact vs detached areas and G) PODXL, H) ECAD, and I) LTL intact areas (mean ± stderr, n ≥ 21 organoids per condition pooled n ≥ 6 independent experiments; ***P<0.00, **P<0.01, *P<0.05 by one way ANOVA. Outlier data points are shown in fig. S3). J) Representative confocal immunofluorescence images showing a single optical section (20x magnification) of organoids derived from WA09 ES cells ± TNF-alpha. K) Quantification of PODXL intact vs detached areas, % intact, and % detached areas (mean ± stderr, n ≥ 18 organoids per condition pooled n ≥ 2 independent experiments; outliers data points are shown in figure s-3, ***P<0.001, **P<0.01, *P<0.05 by one way ANOVA). L) Representative confocal immunofluorescence images showing a single optical section (20x magnification) for each condition. M) Quantification of PODXL intact vs detached areas and PODXL and ECAD intact areas (mean ± stderr, n ≥ 14 organoids per condition pooled from 3 independent experiments; outliers data points are shown in supplementary figure s-3, ***P<0.001, **P<0.01, *P<0.05 by one way ANOVA).
Article Snippet: Primary antibody used: LTL (Vector Laboratories) specie: biotin 1/500 dilution, ECAD (Abcam) specie: rat 1/300 dilution, PODXL (Invitrogen) specie: goat 1/500 dilution, ZO1 (Thermo Fisher Scientific) monoclonal 1/100 dilution.
Techniques: Staining, Immunofluorescence, Derivative Assay